
Having the right data and insights to make informed decisions is key to building better marketing and fundraising strategies. While the NFP sector is very diverse, these are the common key analytics nonprofits track as they often provide the most meaningful insights.
- Web Analytics (3)
- Email Analytics (3)
- Social Media Analytics (1)
- Fundraising Analytics (1)
- Financial Analytics (2)
1. Website Analytics
The website is often the hub of a nonprofit’s digital footprint. It can also be a key source of online donations, digital advocacy actions and digital event registration / engagement efforts. If you haven’t already, consider setting up a free Google Analytics account so the team can have easy access to the most vital website metrics. While other products (e.g. WordPress Matomo plugins) offer similar reporting metrics, the Google Advertising platform can tap into additional metrics like demographics and audience interests.
Let’s look at the most fundamental metrics:
a) Acquisition Reports or Website Traffic Sources
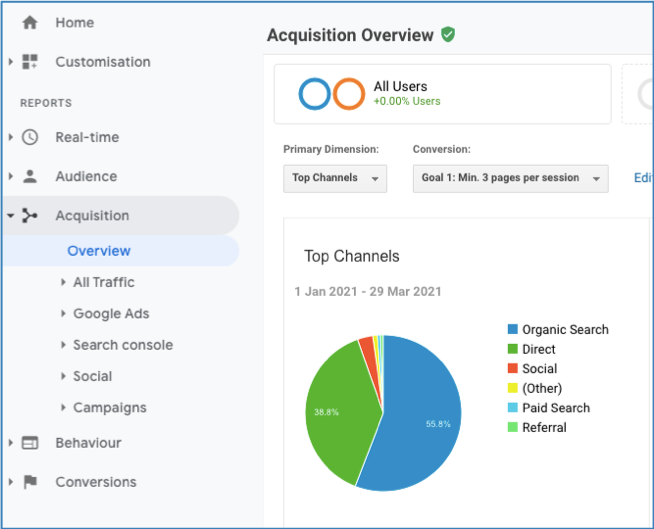
Organic Search = visitors who find you website via a search engine
Direct = visitors who type in your URL or have your website bookmarked and so know your brand
Social = traffic from social media platforms
Paid Search = traffic from paid search ads (aka a Google Ad Grant)
Referrals = more broadly websites, blogs etc. driving traffic to your website
As you click on the details provided in the reporting, assess not just the quantity of traffic coming to your site, but the quality of traffic being referred to your site from various sources. What interested them when they visited your site / what content were they consuming? Within Analytics, you can set up a secondary reporting view based on the webpage your visitors enter / land on (and where they exit from). For search engine traffic, you also want to look at what keywords or phrases they were using that brought them to your site.
b) Website Conversion Rates
Teams then need to take their website tracking to the next level and set up website conversion rates. While most people think conversion = donate, teams can set up conversion reports for any action they want to measure. If they are trying to increase Email subscribers – they may want to track how many individuals complete the registration process and reach the “You’ve subscribed” confirmation page. A similar process can be set up to track event registrations, completing an online donation form, signing up to volunteer or even an online petition. Now teams can not only see how many people signed-up, but which traffic sources are driving the most actions / conversions.
Link: Google Conversion Tracking
c) Google Grant Advertising Conversions
Registered charities that have secured a Google Grant are using the Google Ads platform to run ads on Google platforms. You can integrate your Google Ads, Google Search Console and Google Analytics Accounts to order to integrate all your data. Once the accounts are linked you will be able to easily view data related to various campaigns, site links, search queries, keywords and much more.
Ensure you take the time to set up your Google Ads account to properly track and bill your ads to match your accounting set up.
2. Email Analytics
Email is often called the workhorse of nonprofit marketing campaigns because it is so effective. Depending on the marketing platform the team is using, you will be able to access reports that benchmark all their client data to compare your performance to.
MailChimp email Benchmark Statistics – https://mailchimp.com/resources/email-marketing-benchmarks/
Constant Contact eMail Benchmark Statistics – https://knowledgebase.constantcontact.com/articles/KnowledgeBase/5409-average-industry-rates?lang=en_US
Campaign Monitor eMail Benchmark Statistics – https://www.campaignmonitor.com/resources/guides/email-marketing-benchmarks/
d) Email Open Rates
First and foremost is looking at whether your audience is even seeing your message by opening your email. Most Canadians have at least three email addresses (work, home, school, junk/subscriptions, etc.) and these can change often. So list maintenance is key, as well as ensuring readers are adding your email to their address book to avoid spam filters and finding your subject lines interesting so they click on the actual email to open it. Remember, people can get dozens of emails each day and you are competing with a lot of inbox content so you need to craft subject lines that help you stand out.
e) Email Click-Through Rates
So we know they opened the email, but did they actually see your message / skim any of the content?! You know they are interested if they click on a link in the email to complete an action or find out more information. To maximize this content engagement metric, ensure you are personalizing your emails which means you are using marketing segmentation to tailor content to your audiences (vs. sending the same messages to new prospects as long-time donors or volunteers!).
f) Subscribe / Unsubscribe Rates
We’ve noted the importance of the health of your overall list, but it is also important to track the number of new subscribers as you grow your audience, as well as the number who unsubscribe. Does your unsubscribe form ask people for feedback (e.g. you send too many emails) to help you ensure you are maximizing your email opportunities?
3. Social Media Analytics
Now that we have set up website tracking to see which social media accounts are performing and what posts / content in particular drive the most traffic to our website, on the social media platforms we are most interested in engagement measures to again assess quality vs. quantity. Every platform has its own native analytics for teams to dive into. For Facebook Pages (vs. Personal Profiles) you will find them in the Insights Tab, for Twitter, you navigate to Twitter Analytics (and use Twitter Cards or Ads) and for Instagram and Pinterest you need business accounts to see the most relevant data. Ensure you understand what you are counting if you are comparison across channels. Linkedin for example calculates “engagement” with a different formula than Facebook uses, as they include new followers acquired.
g) Engagement: Likes, Comments, Shares and Clicks
Engagement basically boils down to how much your audience is engaging with the content you post. Each network will have a “total” engagement measure that sums up actions like comments, retweets and shares. High engagement rates will indicate what % of your followers are “active” in that they are aware of your brand and interested in your content.
Impressions often = how many times your post shows up in someone’s timeline
Reach often = the unique viewers your posts have.
Sentiment = whether the comments about your brand are positive, neutral or negative.
4. Fundraising Analytics
We’ve already covered how we can track measure online donations – we can look at who clicks on email fundraising links, goes to our donation pages and completes donation forms. So from our previous two metrics, we know which fundraising efforts are driving donations, but we also want to look at:
h) Donor Retention Rates
Acquiring donors can be expensive as we work to make them familiar with our brand / mission / vision and gain their trust. To understand the full cycle from new donor acquisition to loyal donor stewardship and retention we need to look at if we are retaining their support over time.
5. Financial Analytics
Marketing teams need to understand what metrics they need to understand what’s working and what isn’t as they assess tactics, but they also need to be able to roll up the learnings into Board / Management level reports to help the overall organization govern operational expenses and performance metrics.
i) Campaign ROI & Revenue Forecasting
We can use our performance reports to not only sum up the overall ROI for particular campaign efforts (e.g. Spring eMail Donor Drive), but we can use historical and predictive analytics to help measure how sustainable our revenue sources may be year-over-year. Teams should sit down with their CFOs to talk about how to ideally set up reports to automate this with ease. For example, ensuring “campaigns” for Google Grant account spending aligns with how a CFO has to report the cost of fundraising vs. mission activities. Billing in Google Ads happens at the “campaign” level, so if it’s not set up properly, the team won’t be able to separate the costs of mission vs. events vs. volunteer vs. fundraising etc. marketing efforts.
- What are the key sources of funds each year and the true ROI for those channels?
- How much revenue can we expect from recurring online gifts next year?
j) Cost per Dollar Raised
e.g. The Spring 2021 Email appeals cost $1,024 as there was not a lot of staff time involved in duplicating / updating our last year’s campaign – and it raised $14,250, so our cost per dollar raised was $0.07 – or as donors view it 93 cents from every $1 donated can be allocated to mission.
While we can all agree that the cost of fundraising alone is not an accurate measure of the impact a charity has, breaking down revenues vs. expenses is a CRA T3010 reporting requirement and a question donors have been trained to ask as one way of measuring how efficient a charity is being. Given the diversity of charities in the sector, it isn’t a helpful comparison tool but is a helpful internal metric as teams look to evaluate their efforts along with other mission and marketing impact measurements.
- When we send an email what % of the content is dedicated to fundraising vs/ mission so we can determine how to attribute the costs?
- How much did our fundraising and marketing effort cost (including staff time etc.), divided by the amount it brought in? Remember to not double count! If a donor gave last year via cheque and this year via online – there might not be any incremental revenue. Stepping back to look at the bigger picture across campaigns and channels is also important.
Again, work with your CFO as the cost of fundraising can be complicated as you factor in volunteer time at events and the associated costs to recruit, train, thank, etc. It can also be impacted by proceeds from sponsors and other activities so the team needs to be aligned on how costs are allocated and tracked. Taking the time to understand the full financial analytics will ensure the team isn’t sinking major resources into efforts that aren’t paying off.
To learn more about nonprofit marketing analytics and how you can leverage technology to get more from your data, connect with the brandrewire.ca team or take a deeper drive through one of our online courses.